2.3 KiB
Run with Docker
⚠ This is a bit more involved of a setup than just running the jar ⚠
Prerequisites
Docker Desktop for your operating system.
Once installed, you can check that it works by opening a command prompt and running
docker run -it hello-world
Run as a standalone container
Use either a specific image, preferrably the latest image published
While it might work, using
registry.gitlab.com/mangadex-pub/mangadex_at_home:latestis a bad idea as we do not guarantee forward-compatibility
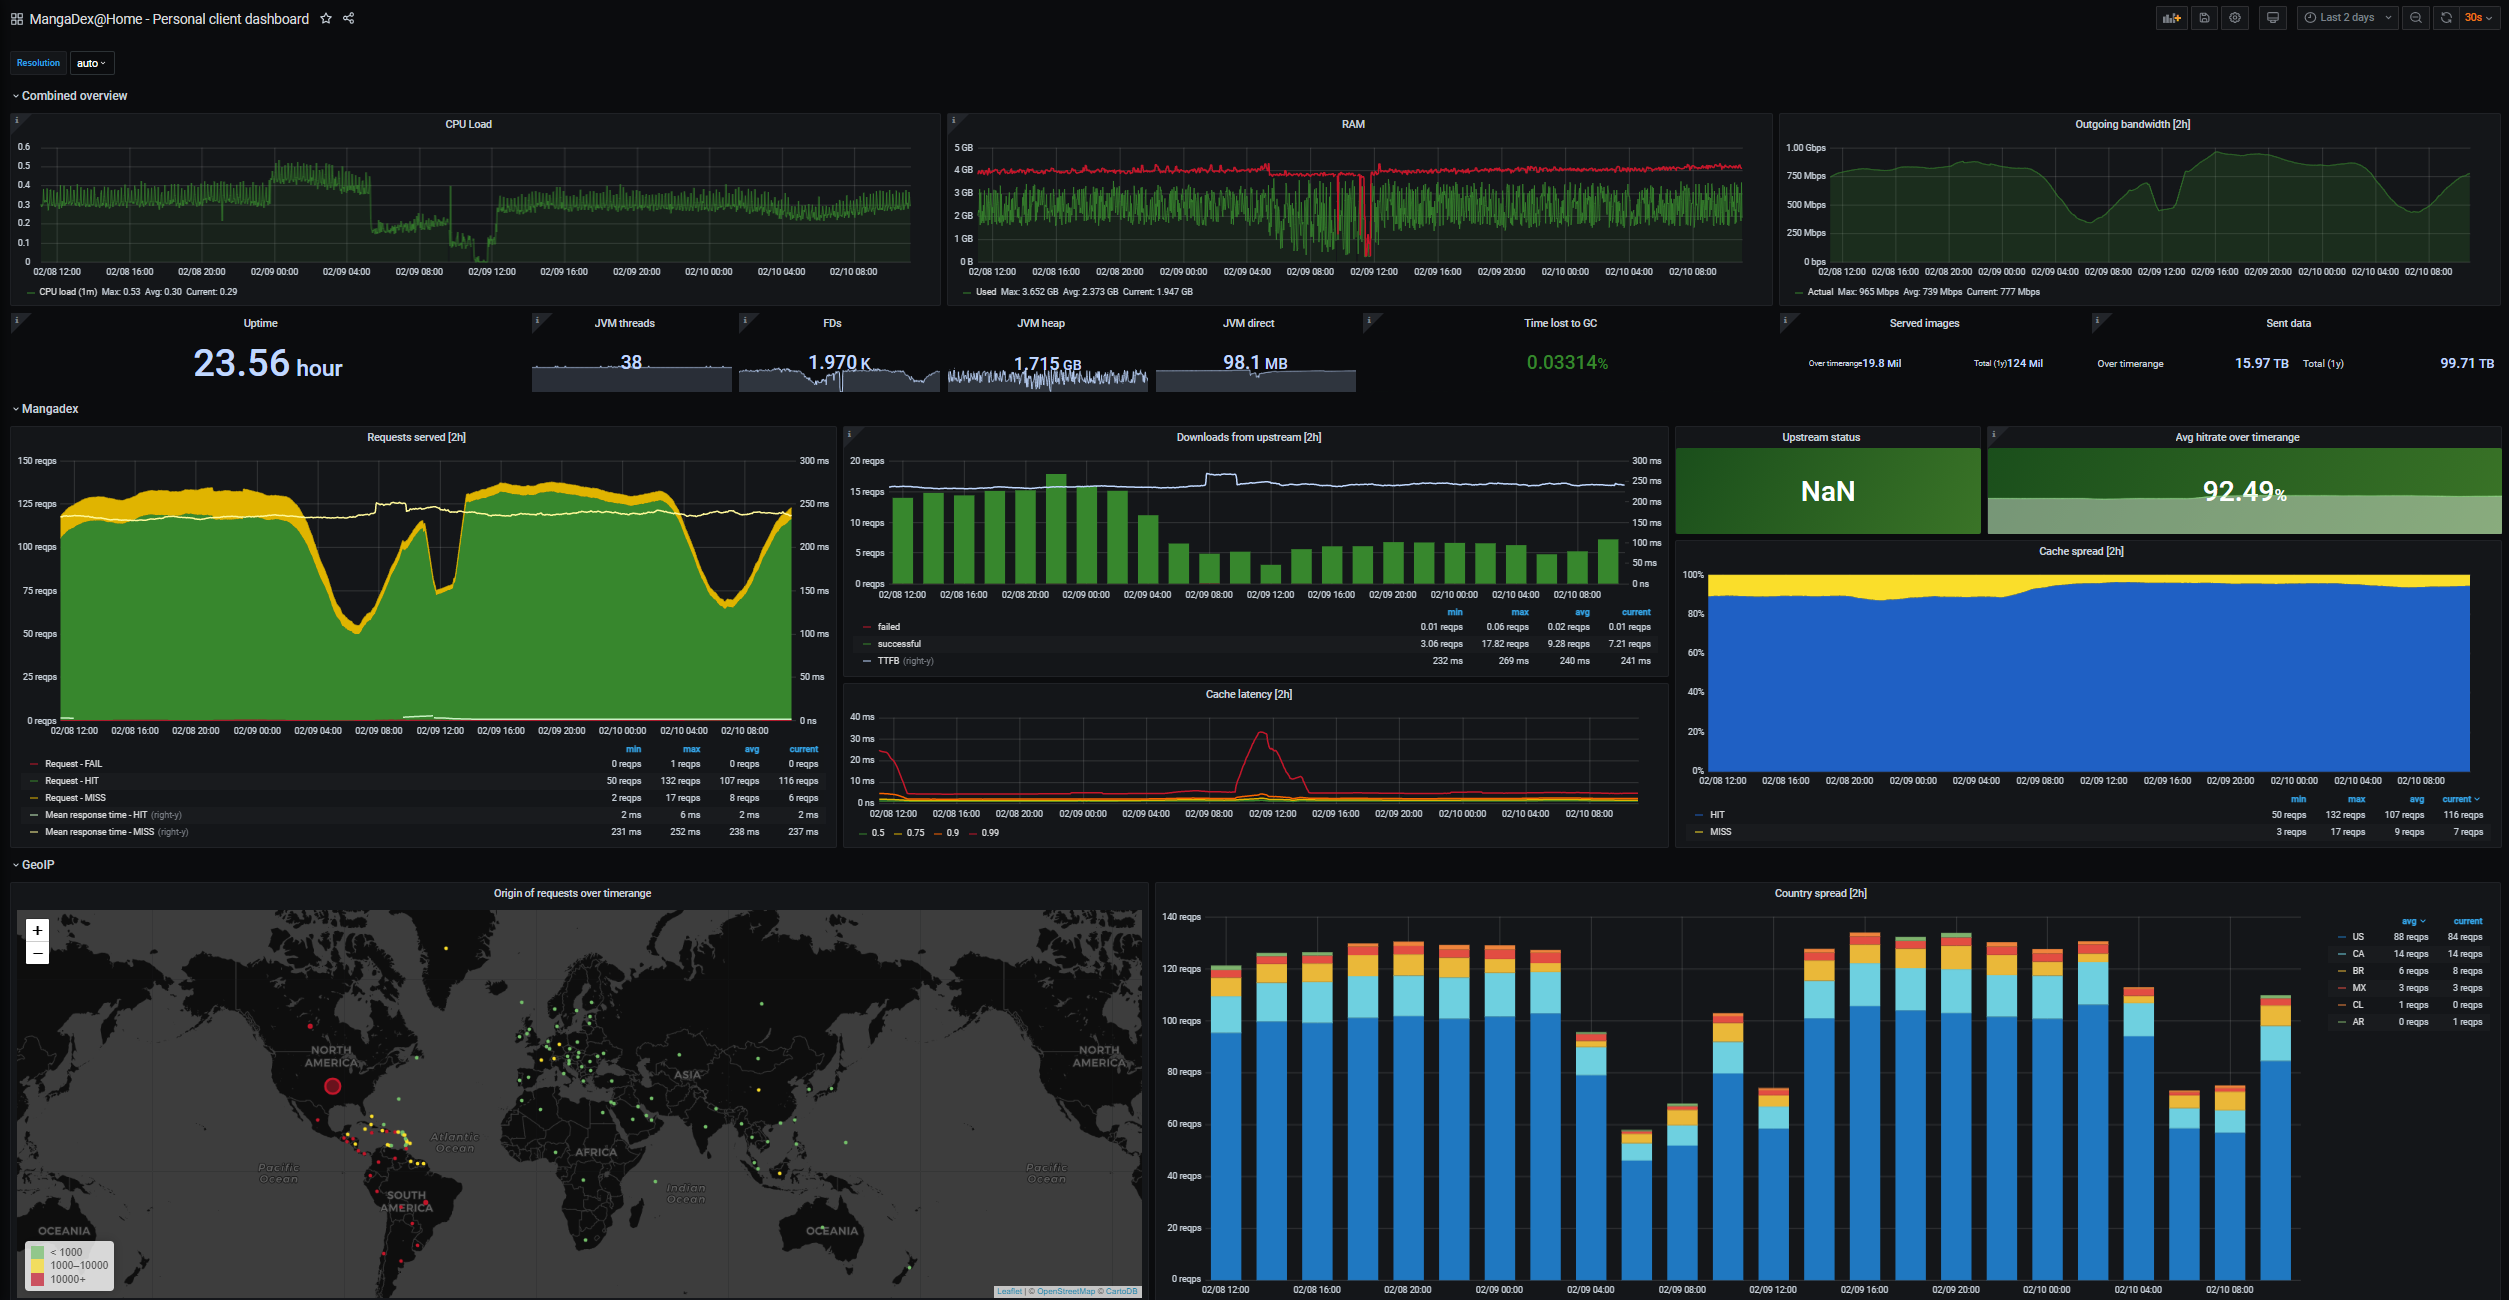
Run with Prometheus and Grafana (i.e. dashboards)
Quickstart
-
Install
docker-compose. Follow the steps here -
Copy the
dockerdirectory somewhere on the drive you want to use as cache storage*a. edit
docker-compose.ymland replaceregistry.gitlab.com/mangadex-pub/mangadex_at_home:<version>with the appropriate version -
Copy your
settings.yamlinside that directory (it should be next todocker-compose.yml) -
Run
docker-compose up -dfrom within this directory -
That's it. You should now check the following:
- There are 3 containers in 'Up' state when running
docker ps(mangadex-at-home,prometheusandgrafana) - The test image loads at https://localhost/data/8172a46adc798f4f4ace6663322a383e/B18.png
- Prometheus loads at http://localhost:9090
- Grafana loads at http://localhost:3000/dashboards and you can open the dashboard
- There are 3 containers in 'Up' state when running
Notes
The pre-made configuration is hardcoded both public port 443 and this directory structure:
<directory where you run 'docker-compose up'>

    Folders/files copied from the git repository
    -> prometheus/... - pre-made config
    -> grafana/... - pre-made config
    -> docker-compose.yml

    Your settings.yaml
    -> settings.yaml

    Created by the containers
    -> data/
        -> cache - the client's image cache
        -> prometheus - prometheus database files
        -> grafana - grafana files
All of this is configurable to suit your needs but is not recommended unless you are familiar with Docker already.
